3 min read
Honchō Scoops Up Two UK Search Awards!
It’s official, we've added not one, but two shiny trophies to our awards cabinet! We’re over the moon to share that we’ve triumphed at the UK Search...
2 min read
 Jack Grantham
:
Feb 25, 2019 8:58:08 AM
How are you measuring the success of your campaigns? We, like many others, use historical data to show the month-on-month improvement our campaigns are making, which is great. It allows us to show we’re doing better than we were before – which must mean our campaigns are a raging success right? Well not quite. We can see we’ve improved against ourselves but how does that stack up against the rest of the industry?
This is where knowing your industry benchmark figures is key. Measuring your campaign’s performance against the industry averages will show you whether your campaign is truly a success. If you are looking to measure the impact of your content, checking out what UTM and GA can do for you, would also be helpful in tracking success.
As an agency, we’re working with a range of clients, operating in both retail and automotive industries. As a result of this, we need to understand benchmark figures for each of the industries. This helps us know what metrics we should be looking to beat to ensure that our campaigns are operating above and beyond the current industry benchmark.

Why are benchmark figures so important to your business? Well, without a benchmark, you have no way to gauge how well you’re actually doing. Reporting based solely on your own historical data can often be very misleading.
For example, let’s say your conversion rate in Q1 was 2% and in Q2 you saw it rise to 2.75% – on the surface this would sound excellent, but you know that the industry benchmark is actually 3.55% – which leaves you quite some way behind the industry average. It suggests there is lots of work that needs to reach and eventually eclipse the benchmark figures, which of course is where we all want our campaigns to reach.
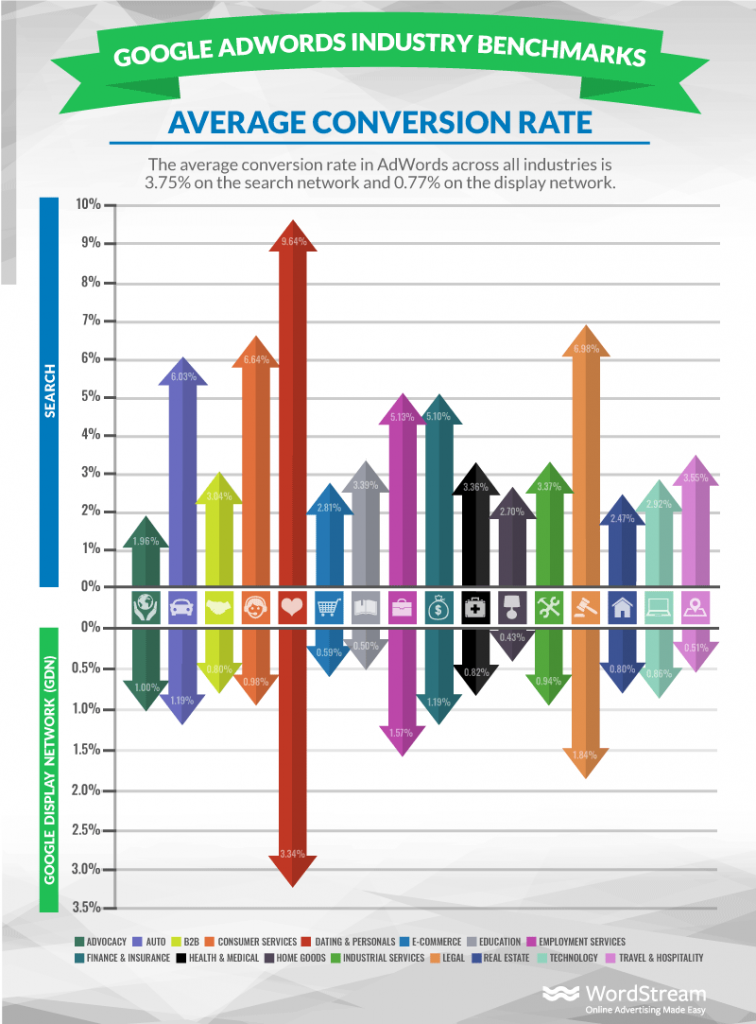
So what is the industry benchmark for your industry? On average as a whole, Google Ads conversions rate is currently 3.17% on the Search Network and o.46% on the Display Network. This is broken down by each industry as follows:

{Image Source: https://www.wordstream.com/blog/ws/2016/02/29/google-adwords-industry-benchmarks}
To conclude, knowing your industry benchmarks are vital for understanding where you truly stand against others in your industry. This only puts more emphasis on the need to continuously optimise your campaign to reach the average marker and ascending beyond that to mark, to lead your industry with highly profitable campaigns. Be sure to stay up-to-date with your industry’s benchmark figures going forward and continue to strive to blow the benchmark out of the water.
Let us know your thoughts on how you’re performing in line with your industry benchmark and comment below or tweet @Honcho_Search.

3 min read
It’s official, we've added not one, but two shiny trophies to our awards cabinet! We’re over the moon to share that we’ve triumphed at the UK Search...

5 min read
Understand ecommerce attribution models which attribution models can maximise your marketing efforts and ROI.

3 min read
Explore how social commerce is changing the way we shop online, blending social interactions with digital commerce for a seamless buying experience.